 Enzo O'Hara Garza
1 min read
Xero vs Quickbooks: Which is Best for Your Business?
Are you a small business owner looking for the right accounting software to manage your finances? Choosing the right accounting software for your...

Have you ever looked under the hood of your car and marveled at how all those parts work together to get you from Point A to Point B? Your business's financial system is pretty similar. It's a complex engine that, when fine-tuned and well-maintained, can drive your business towards greater profitability and success. At the heart of this engine is your Chart of Accounts (COA).
Your COA is more than just a list of account names and numbers. It's the backbone of your financial system, a roadmap that guides you through your business's financial landscape. But like any good roadmap, it needs to be up-to-date and detailed enough to be useful.
In this blog, we'll delve into the world of COAs. We'll discuss why it's crucial to adjust your COA regularly, and how you can "hack" your COA to optimize your profitability. Whether you're a seasoned entrepreneur or just starting your business journey, this guide will help you harness the power of your COA to steer your business towards financial success. So, buckle up and let's get started on this exciting journey.

The Chart of Accounts (aka the COA) plays a pivotal role. It serves as a centralized framework for recording, organizing, and classifying your business's financial transactions.
The Chart of Accounts is a comprehensive list of all accounts - or financial categories - used by a business. Each account corresponds to a specific segment of your business's finances and is assigned a unique code to facilitate in-depth financial tracking and analysis.
The Chart of Accounts is not a static entity. Rather, it is a dynamic instrument that evolves with your business, mirroring its growth and changes. As your business expands, you may introduce new products, enter new markets, or invest in new assets, all of which may necessitate the addition of new accounts to your Chart of Accounts.
The Chart of Accounts serves several critical purposes:
Organization: The Chart of Accounts provides a structured system for recording financial transactions, ensuring that each transaction is classified correctly and consistently.
Financial Reporting: The Chart of Accounts forms the basis of your financial statements. The arrangement and classification of accounts in your Chart of Accounts directly impact how information is presented in your balance sheet, income statement, and cash flow statement.
Financial Analysis: The Chart of Accounts facilitates financial analysis by grouping similar transactions together. This allows you to evaluate specific areas of your business, track trends, and make informed decisions.
Regulatory Compliance: A well-organized Chart of Accounts helps ensure accurate financial reporting, which is crucial for compliance with financial reporting standards and tax laws.
The Chart of Accounts is a crucial accounting tool that helps maintain financial order, supports informed decision-making, and ensures regulatory compliance.

The Chart of Accounts typically includes five main types of accounts:
Assets are an essential element, as they represent resources owned or controlled by a business which are expected to provide future economic benefits. All assets, whether they're a building, a patent, or even cash in the bank, are categorized as either current (short-term) or non-current (long-term) based on their liquidity, i.e., how easily they can be converted into cash.
Current Assets also known as short-term assets, are resources that a business expects to convert to cash, sell, or consume within one year or its operating cycle, whichever is longer. They're called "current" because they constantly flow in and out of the business in the normal course of operations.
Here are the primary types of current assets:
Cash and Cash Equivalents: This includes physical cash, bank account balances, and investments that can be readily converted to cash, such as treasury bills or money market funds.
Accounts Receivable: This is money owed to your business by customers who have purchased goods or services on credit.
Inventory: These are goods that a business intends to sell. For a retailer, this could be merchandise bought for resale. For a manufacturer, it might include raw materials, work in progress, and finished goods.
Prepaid Expenses: These are payments made in advance for goods or services to be received in the future, such as prepaid insurance or rent.
Non-current assets, also known as long-term assets, are resources that a business expects to use or benefit from for more than one year. Unlike current assets, non-current assets are not intended to be converted into cash or consumed within a year. They are typically used in the operation of the business to generate revenue over a long period.
Here are the common types of non-current assets:
Property, Plant, and Equipment (PPE): These are tangible assets that are used in the operations of the business and have a useful life of more than one year. They include land, buildings, machinery, vehicles, and furniture. PPE is typically reported at its historical cost less accumulated depreciation (except for land, which is not depreciated).
Intangible Assets: These are non-physical assets that have a useful life of more than a year. They include patents, copyrights, trademarks, goodwill, and brand recognition. They are reported on the balance sheet at their historical cost less accumulated amortization.
Long-term Investments: These are investments that a company intends to hold for more than a year. They may include bonds, shares of stock in other companies, or real estate.
Deferred Charges: These are costs that are not charged to expense as incurred because they are expected to yield benefits over a long period. An example is the cost of starting up a business.
The classification of assets into current and non-current categories helps in assessing a company's liquidity and financial stability. Current assets are key to understanding the company's ability to pay its short-term liabilities, while non-current assets provide insight into the company's long-term investment and sustainability.
Liabilities represent the financial obligations or debts that a business owes to external parties. So really, they are the opposite of assets. Just like assets, liabilities are also classified as either short-term (current) or long-term (non-current) based on their maturity, i.e., when they are due to be settled.
Short-term liabilities, also known as current liabilities, are obligations that a business is expected to pay off within one year or its operating cycle, whichever is longer. They are part of the everyday operating expenses or debts that are to be paid out of current assets or through the creation of other current liabilities.
Here are the primary types of short-term liabilities:
Accounts Payable: This is money owed by a business to its suppliers or vendors for goods or services received on credit. Accounts payable are expected to be paid off within a year.
Short-term Loans: These are loans that must be repaid within one year. This category includes bank overdrafts and the current portion of long-term loans, i.e., the portion that must be paid within the current year.
Accrued Liabilities: These are expenses that a business has incurred but not yet paid, such as wages payable, taxes payable, and interest payable.
Unearned Revenue: This is money received by a business for goods or services that it has not yet delivered or performed. It is considered a liability because the business still owes these goods or services to its customers.
Non-current liabilities, also known as long-term liabilities, are obligations that are due to be paid beyond one year or the operating cycle, whichever is longer. They are often related to the acquisition of major assets such as buildings and equipment, or to fund major business expansions.
Here are the common types of non-current liabilities:
Long-term Loans: These are loans that are due to be paid over a period longer than one year. Only the portion due after one year is classified as a long-term liability.
Bonds Payable: When a company issues bonds to raise money, it is essentially borrowing from the bondholders. The amount that is due to be paid to bondholders beyond one year is considered a long-term liability.
Deferred Tax Liabilities: These are taxes that a company expects to pay in the future due to timing differences between when a transaction affects items for financial reporting purposes and when it affects items for tax purposes.
Pension Liabilities: These are obligations of a company to pay pension benefits to its employees in the future.
Lease Liabilities: These are obligations to make lease payments under a non-cancelable lease contract.
Understanding the distinction between current and non-current liabilities provides valuable insights into a company's financial health and long-term solvency. Current liabilities tell you about a company's liquidity and working capital management, while non-current liabilities give you a sense of a company's long-term financial strategy and debt management.
Equity represents the residual interest in the assets of an entity after deducting liabilities. In simpler terms, it is the net assets of a business, i.e., what is left for the owners after all debts have been paid. Equity is sometimes referred to as net assets or shareholders' equity, depending on the type of entity.
The composition of equity can vary based on the type of business entity - whether it's a sole proprietorship, partnership, or corporation.
Let's dive deeper into the different types of equity accounts used in these entities.
In a sole proprietorship, the owner is the business, and there is no legal distinction between the two.
The main equity accounts for a sole proprietorship are:
Owner's Capital: This account tracks the owner's investment in the business. It increases when the owner contributes assets or cash to the business, and decreases when the owner withdraws assets or cash from the business for personal use.
Owner's Drawings: This account records the cash or assets the owner withdraws from the business for personal use.
A Limited Liability Company (LLC) is a type of business structure that combines the liability protection of a corporation with the tax benefits and operational flexibility of a partnership. The owners of an LLC are referred to as members, and they may be individuals, corporations, other LLCs, or foreign entities. There is no maximum number of members and an LLC can also be owned by a single member.
The main equity accounts for a limited liability company are:
Member Capital Accounts: Each member has a capital account that tracks the balance of their investment in the LLC. This account includes initial capital contributions, additional contributions, and the member's share of profits or losses.
Distributions: This account records the amount of money or value of property that has been distributed to the members from the LLC's profits. Distributions decrease a member's capital account balance.
Additional Paid-In Capital (APIC): This account is less common in an LLC, but can be used if members contribute more than the stated value of their capital contributions. APIC represents the excess amount.
A partnership is a type of business structure where two or more people share ownership. Each partner contributes to all aspects of the business, including money, property, labor, or skills. In return, each partner shares in the profits and losses of the business.
There are three main types of partnerships:
General Partnership (GP): In a general partnership, all partners share in the management of the business and each is personally liable for all the business debts and obligations. This means that each partner's personal assets could be used to satisfy the partnership's debts.
Limited Partnership (LP): A limited partnership has two types of partners: general partners and limited partners. General partners manage the business and are personally liable for business debts. Limited partners, on the other hand, are investors who do not participate in management and whose liability is limited to the extent of their investment.
Limited Liability Partnership (LLP): This is a type of partnership where all partners have limited liability, which means that they are not personally responsible for the debts of the business. This is similar to the shareholders of a corporation. However, unlike a corporation, the LLP itself is not liable for the debts of the partnership. This type of partnership is common in professions where a high degree of individual skill is required, like law or architecture.
The primary equity accounts for a partnership are:
Partners' Capital Accounts: Each partner has a separate capital account that tracks their contribution to the partnership. It increases with each partner's additional investment and the allocation of profits, and decreases with withdrawals and the allocation of losses.
Partners' Drawing Accounts: Each partner has a separate drawing account that records the cash or assets they withdraw from the partnership for personal use.
A corporation is a type of business entity that is legally recognized as separate from its owners, known as shareholders. This distinct identity gives it certain rights and responsibilities similar to those of an individual, such as the ability to enter into contracts, sue and be sued, own assets, and pay taxes. The ownership of a corporation is divided into shares of stock, which can be bought and sold.
One of the key characteristics of a corporation is limited liability, meaning shareholders are generally not personally responsible for the corporation's debts and obligations. This makes corporations a popular choice for businesses seeking to raise capital and mitigate financial risk.
The main equity accounts for a C-Corporation are:
Common Stock: This account represents the owners' investments in the business. It is credited when the corporation issues shares to shareholders.
Additional Paid-in Capital: This account captures the excess amount shareholders paid over the par value of the stock.
Dividends: This account records the distribution of earnings to shareholders. Dividends decrease retained earnings.
An S-Corp is a special tax structure for small businesses that passes corporate income, losses, deductions, and credit through to their shareholders for federal tax purposes. A lot of people are confused about how S-Corps and LLCs are related, so here's the low down...
An S Corporation (or S Corp) and a Limited Liability Company (LLC) are two distinct types of business structures that offer certain tax benefits and liability protections to their owners.
An LLC is a business structure that provides its owners, known as members, with personal liability protection. This means that the members are not personally responsible for the company's debts and liabilities. Profits and losses from the LLC pass through to the members, who report this information on their personal tax returns. The IRS does not tax the LLC directly, thereby avoiding double taxation.
An S Corp is not actually a business entity like an LLC or a corporation. Instead, it's a tax designation that an LLC or a corporation can elect with the IRS. By electing to be taxed as an S Corp, a company can avoid double taxation—just like an LLC—because the S Corp's income, deductions, and credits flow through to the shareholders' personal tax returns. But unlike an LLC, an S Corp can also allow business owners to save on self-employment or Social Security and Medicare taxes, since owners can be treated as employees and paid a reasonable salary, with any remaining profits distributed as dividends.
Remember that while both structures have their advantages, they also come with certain requirements and restrictions. For instance, an S Corp cannot have more than 100 shareholders, and all shareholders must be U.S. citizens or residents. So, before making any big decisions about the tax tax structure of your LLC, it's important to consult with an attorney or your CPA first.
The main equity accounts for an S-Corporation are:
Common Stock: This represents the value of stockholders' ownership in the corporation based on the par value of shares issued. For S-Corps, the common stock is usually issued to the owners of the business in proportion to their ownership percentage.
Additional Paid-In Capital: This represents any amount paid by shareholders over and above the par value of common stock. This can include amounts paid for preferred stock.
Distributions: This account tracks the amount of profits that have been distributed to the shareholders. These distributions reduce the retained earnings account.
Retained earnings represent the cumulative net income of a company that is retained by the company after it has paid out dividends to its shareholders. Essentially, it's the profit that has been re-invested in the company instead of being paid out in dividends. Retained earnings are recorded under shareholders' equity on the balance sheet.
The retained earnings account can be used by management for investments in the company’s growth through means such as research and development, capital investment, or debt reduction. It's an important indicator of a company's financial health, as it shows the amount of profits that the company has chosen to reinvest back into the business or use to pay off debt, rather than distributing it to shareholders.
Revenue is the total amount of income generated by the sale of goods or services related to a company's primary operations. However, not all revenue is created equal, and it can originate from various sources.
Let's take a closer look at the different types of revenue a business may earn.
Revenue is the income earned from a company's core business operations. This is the primary source of income for most businesses.
The specifics can vary widely across industries, but here are a few common types:
Sales Revenue: This is the income a company generates by selling its products or services. For instance, a clothing retailer would primarily generate revenue through the sale of clothes, while a restaurant would generate revenue through the sale of food and drinks.
Service Revenue: For companies that provide services rather than tangible goods, their primary source of income is service revenue. This could include anything from consulting fees earned by a management consulting firm to tuition earned by a private school.
Other Income, as the name suggests, is income that comes from secondary or non-core business activities. These revenues are often unpredictable and can vary greatly from one period to the next.
Here are a few examples:
Interest Revenue: Interest revenue is money earned from lending investments or money to others, or through interest-bearing bank accounts. For instance, a company might earn interest on a corporate bond it holds, or from money kept in a savings account.
Dividend Revenue: When a company owns shares in another company, it may earn dividend revenue when the company in which the shares are held distributes profits back to its shareholders.
Rent Revenue: If a company rents out property or equipment it owns, the rental payments it receives are classified as rent revenue.
Gain on Sale of Assets: When a company sells off its long-term assets, such as property, plant, or equipment, and the selling price exceeds the book value of the asset, the company records this as a gain on sale of assets.
Royalty Revenue: If a company licenses its intellectual property, such as patents or copyrights, to others, it earns royalty revenue.
While Revenue reflects a company's primary business activities, other income provides valuable insights into financial performance and strategic decisions. A diverse mix of Revenue and Other Income can help a company weather economic downturns by providing alternative income streams.
Expenses in business accounting represent the cost of carrying out operations. They are subtracted from revenues in determining a company's net income or loss.
Let's delve into the different types of expenses, focusing on operating expenses and cost of goods sold (COGS).
Expenses, commonly referred to as Overhead, are costs associated with the day-to-day operations of a business. These expenses are necessary for the business to function and generate revenue, but they are not directly tied to the production of goods or services.
Here are some examples of operating expenses:
Salaries and Wages: These are the costs of compensating employees for their work. This category also includes benefits, payroll taxes, and similar employee-related expenses.
Rent and Utilities: If a company rents office space or pays for utilities like electricity, water, or internet service, these costs are classified as operating expenses.
Depreciation and Amortization: These expenses reflect the reduction in value of long-term assets like machinery, equipment, or intellectual property over time.
Advertising and Marketing: Any costs related to promoting a company's products or services fall under this category.
Insurance: Premiums paid for various types of insurance, such as liability insurance, property insurance, or health insurance for employees, are considered operating expenses.
Direct Costs, also know as Cost of Goods Sold or COGS, represents the direct costs of producing the goods sold by a company. This includes the cost of the raw materials and labor directly used to create the product. It does not include indirect expenses like distribution costs or sales force costs. Direct Costs are often the largest expense for companies that sell physical goods.
Here are the components of Direct Costs:
Raw Materials: This includes the cost of all the materials used in creating the product.
Direct Labor: This is the cost of the work done by employees who actually make the product.
Factory Overhead: These costs are necessary to operate the factory where the product is made. They include things like electricity for the factory, depreciation on the factory equipment, and factory supplies not tied directly to specific products.
Differentiating between Operating Expenses and Direct Costs is crucial for financial reporting, tax calculation, and business valuation. Direct Costs directly affects a company's gross margin, which is a key indicator of a company's profitability and efficiency in managing labor and supplies. Operating expenses, on the other hand, demonstrate how well a company manages its costs relative to its income.
As you can see, the Chart of Accounts is a fundamental component of your business's financial management system. By providing a structured framework for recording, classifying, and analyzing your financial transactions, the Chart of Accounts supports effective financial management and contributes to your business's overall success.
Creating Revenue Accounts that correspond with Direct Costs (aka COGS) Accounts can be a smart move for businesses. This accounting strategy provides a more detailed and accurate picture of a company's financial health and operational efficiency.
Here's why you should consider customizing your Chart of Accounts to link Revenue and Direct Costs:
It enables businesses to track and compare revenue and direct costs for each product line or service. This helps in identifying the most profitable and least profitable areas of the business, which can inform pricing, marketing, and inventory management decisions.
Pairing Revenue and Direct Costs accounts makes it easier to calculate key financial metrics such as gross profit and gross margin, both of which are crucial for assessing a company's profitability. When you can clearly see the relationship between the revenue you're generating and the direct costs associated with producing those goods or services, you're better equipped to make strategic business decisions.
This strategy can streamline financial reporting and tax preparation. Having a clear and organized system for tracking revenue and Direct Costs can save time and reduce the likelihood of errors during the reporting process.
By closely monitoring these accounts, businesses can more quickly identify and address any issues, such as rising costs or declining revenues. This proactive approach can lead to more effective cost management and improved financial performance.
While setting up corresponding Revenue and Direct Costs accounts may require some initial effort, the clarity and insight they provide can be invaluable for managing your business's financial health and driving profitability.
If you're using Xero, one of the world's leading cloud-based accounting software, creating a COA is a breeze. But don't worry if you're not a seasoned accountant or a tech guru - we've got you covered. In this section, we'll walk you through the process of setting up a Xero Chart of Accounts, step by step, so you can keep track of your business finances like a pro. Whether you're a small business owner, a freelancer, or simply someone interested in learning more about Xero and accounting, roll up your sleeves and let’s dive in!
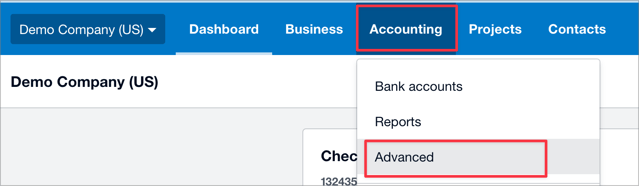
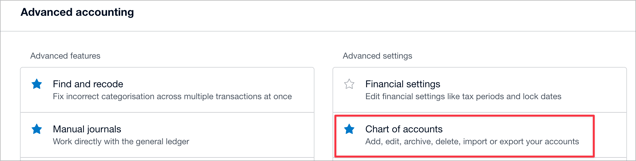
The Chart of Accounts can be found under Accounting > Advanced > Chart of Accounts
Xero makes it really easy to understand how to add new accounts to your Chart of Accounts.
This is what you will see after clicking +Add Accounts on the Xero Chart of Accounts screen.
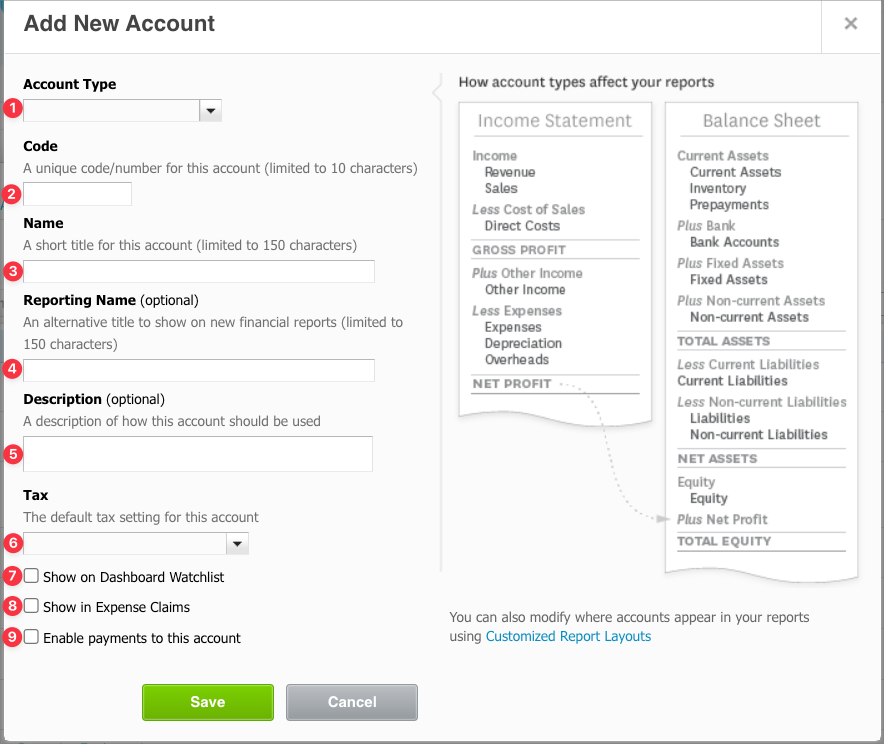
"Account Type" refers to the accounts discussed above.
The available account types are: Assets represent resources owned or controlled by a business that provide future economic benefits. They can be categorized as current or non-current based on their liquidity.
The account you choose determines what financial statement a transaction will end up on, and also what section of that financial statement.
Revenue, Direct Costs, and Expenses are on the Income Statement (aka the Profit and Loss).
Assets, Liabilities, and Equity are listed on the Balance Sheet. Additionally, both Assets and Liabilities are listed in order most liquid to least liquid.
"Code" it the number that you assign to each account in the Chart of Accounts. This code is part of a series of numbers assigned to each account. When creating an account code numbering system, you want to make sure you leave yourself room to add and remove accounts as your business grows. This is why we advise against using smaller numbers like 1, 2, 3, 4.
As an Accounting Prose client, you will see your accounts assigned a 5-digit code. This leaves plenty of room to rearrange accounts if your reporting needs to change.
Here is the numbering system that we use:
10000 Assets (like bank accounts)
12000 Receivables
13000 Inventory
14000 Prepaids
15000 Fixed Assets (Property, Plant, and Equipment)
16000 Accumulated Depreciation (Contra Assets)
17000 Non-Current Assets
18000 Inter-company Receivables
19000 Other Non Current Assets
20000 Liabilities
21000 Payables
22000 Accrued Compensation
23000 Other Accrued Expenses
25000 Accrued Taxes
27000 Long Term Debt
28000 Inter-company Payables
29000 Other Non-Current Liabilities
30000 Equity
40000 Revenue
50000 Cost of Goods Sold
60000 Operating Expenses
99999 Suspense (this is for transactions that are missing enough information to reconcile completely)
This is a brief description of the account. Xero includes standard names, but you can customize these to suit your business. For example, instead of 'Stationery,' you might specify 'Office Supplies.'
A Reporting Name is a label assigned to an account in your Chart of Accounts (Chart of Accounts) to categorize it for reporting purposes. It allows similar accounts to be grouped together, making your financial statements more organized and easier to understand.
For example, we might have the following accounts that relate to General and Administrative labor costs:
|
GA: PR: Salaries And Wages |
|
GA: PR: Payroll Tax |
|
GA: PR: Benefits: Health Insurance |
|
GA: PR: Benefits: Mileage |
|
GA: PR: Benefits: Retirement |
|
GA: PR: Insurance: Workman's Comp |
|
GA: PR: Subcontractors |
Those names are awfully long and would take up a lot of space on the Income Statement.
We would use reporting names that look like this:
|
Salaries and Wages |
|
Payroll Tax |
|
Health Insurance |
|
Mileage |
|
Retirement |
|
Workman's Comp |
|
Subcontractors |
Now, you may be wondering what will happen if all of our labor costs for other departments, like Sales and Marketing, Officer Compensation, and Research and Development all appeared that way on the Income Statement. We use account groupings on custom financial statements in order to nest costs for each department , so that we don't see a jumbled up mess on the Income Statement.
When we create these groupings, we can see the super long names in the first example, because that is the "behind the scenes" account name. Pretty slick!
This is an optional field where you can provide more details about the account. It can be helpful for others who might be using your Chart of Accounts.
This assigns the appropriate tax rate to each account. Xero has a list of tax rates, but you can also add custom rates.
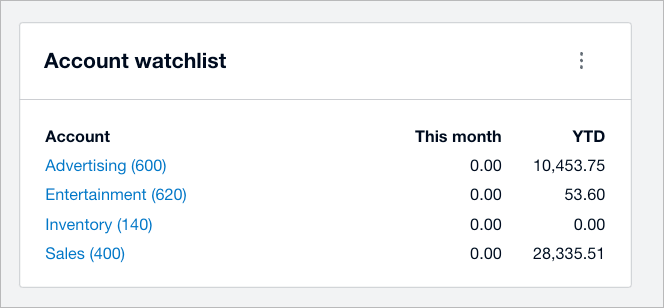
Selecting this option will show the account balance on the Xero dashboard.
If you tick that button, this is what you would see:
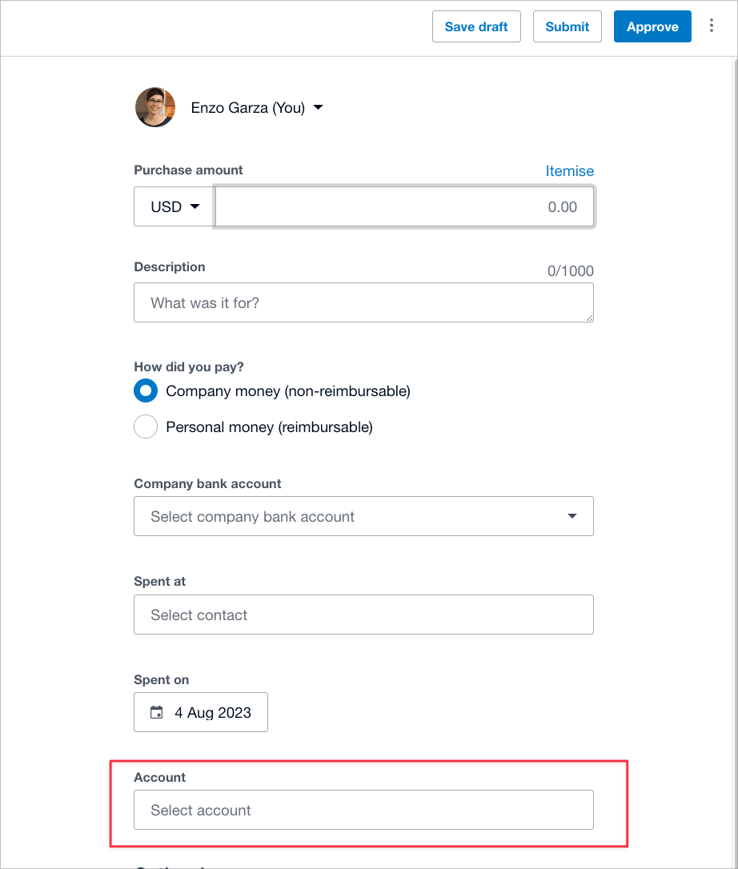
If you check this box, the account will appear as an option when users are submitting expense claims.
The red box indicates where you would find that account with Xero Expense Claims.
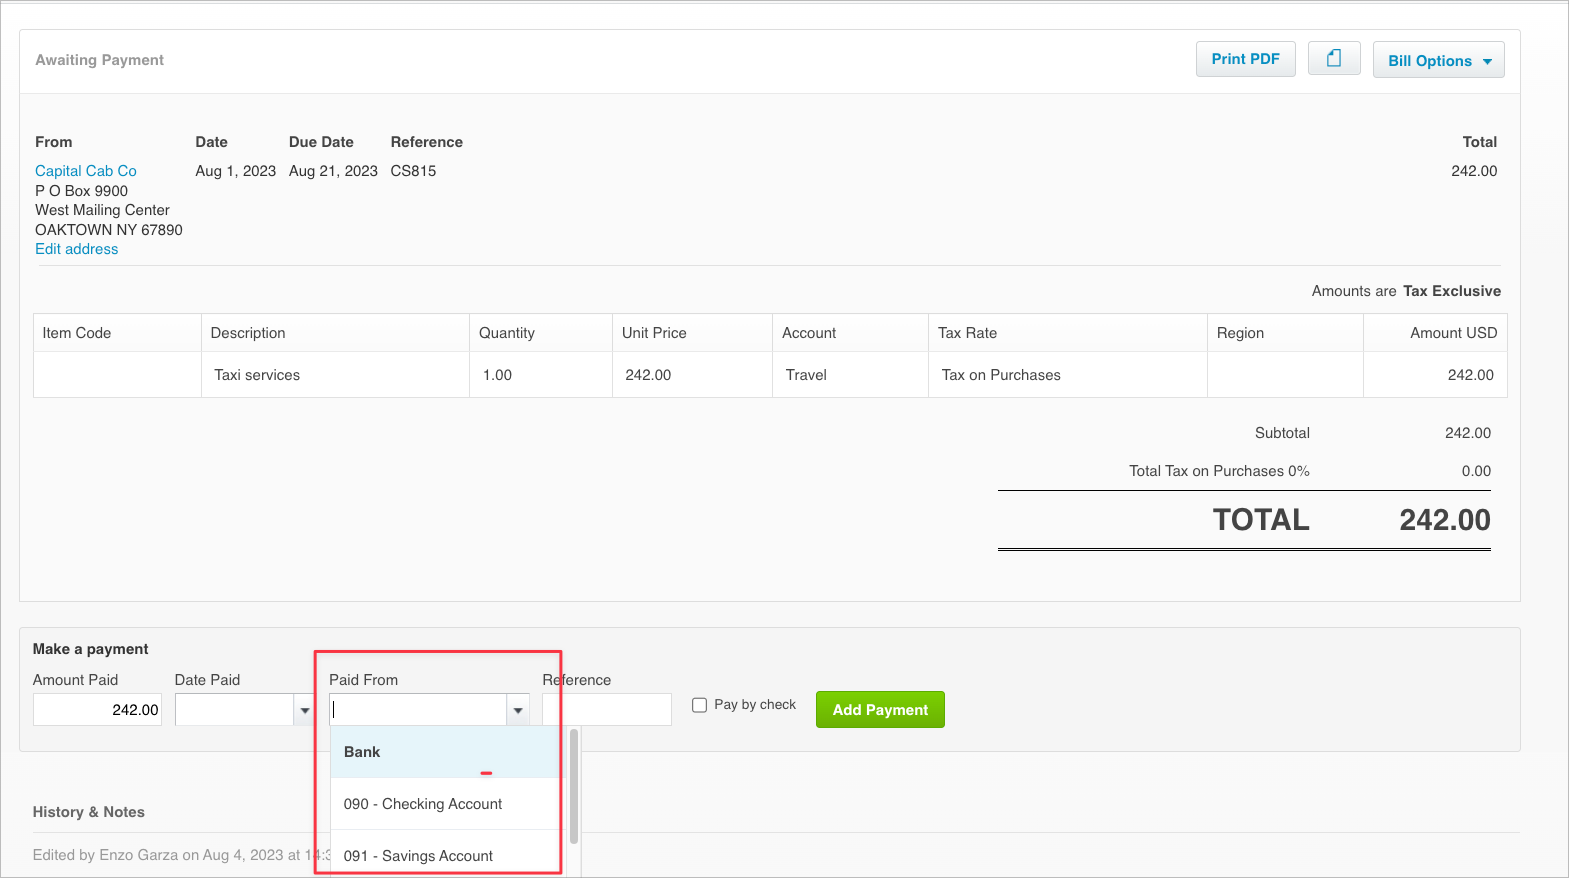
By checking this box, you allow payments to be made to or from this account. You aren't necessarily initiating payment from this account, but rather indicating what account a transaction, like a bill, was paid from.
Regularly adjusting and updating your Chart of Accounts (COA) is like giving your car a tune-up. Just as your car runs smoother and more efficiently after a tune-up, your business's financial management can improve with a well-maintained COA.
Here's why:
Business Evolution: Your business isn't static. It evolves, with new income streams, expenses, assets, and liabilities appearing as you grow. Updating your COA ensures it reflects the current state of your business and can accurately track all financial activities.
Improved Accuracy: Regular adjustments can help catch and correct errors, reducing the risk of misstated financial statements. This is particularly important when it comes time for tax preparation or if you're seeking outside investment.
Enhanced Financial Analysis: A current, well-structured COA provides better data for financial analysis. You can clearly see where money is coming in and going out, which can inform strategic decisions about budgeting, cost management, and growth strategies.
Regulatory Compliance: If there are changes in financial reporting standards or tax laws, you may need to adjust your COA accordingly to ensure compliance.
Efficient Operations: Over time, some accounts may become irrelevant or overly complex. Regularly reviewing and streamlining your COA can make your accounting processes more efficient.
Adjusting your COA on an ongoing basis helps ensure that your financial records are accurate, comprehensive, and meaningful. It's a small investment of time that can pay off in a big way for your business's financial health and success.
There are four ways to add a new account:
From the Chart of Accounts page, click “Add New Account,” Fill in the blanks, and click Save
From the Chart of Accounts page, click “Add Bank Account.” Xero will first ask for the name of your bank to look for automatic bank feed availability. Simply follow the prompts on each page to add your new bank account.
You’ll want to use this when starting a new Xero file if you already have a Chart of Accounts ready to go. Hit “Import” and choose the .csv file from the “Browse” button. You can also download a template to build a Chart of Accounts from scratch.
If you want to make bulk edits to your existing Chart of Accounts, such as adding a 5-digit account code, simply click the Export button. This will export a .csv file of all your current accounts to your computer. Make the necessary edits and then use the Import feature above to update Xero.
Be careful! It’s always good to save a copy of your current Chart of Accounts before editing with this option. This will ensure you have a neat copy if you accidentally make any edits you are not happy with.

"Hacking" your Chart of Accounts (COA) doesn't involve any illicit activity - instead, it's about intelligently structuring and using your COA to gain valuable insights that can boost your profitability.
Here are five strategies to help you do just that:
Granular Revenue and Expense Tracking: Create specific accounts for different revenue streams and types of expenses. This will allow you to see exactly where your money is coming from and where it's going, helping you identify profitable areas and spot opportunities for cost savings.
Pair Revenue and COGS: As we've discussed earlier, creating corresponding Revenue and Cost of Goods Sold (COGS) accounts can help you calculate gross profit margins for individual products or services. You can then focus on promoting high-margin items or work on reducing costs for low-margin ones.
Regularly Monitor Account Performance: Don't just set up your COA and forget about it. Regularly review the performance of each account. If an account is consistently underperforming (for example, a product line that's not generating much revenue), it might be time to consider why that is and what can be done about it.
Align Your COA with Your Budget: Your COA and your budget should work hand in hand. When setting up your COA, consider the budget categories you've established. This alignment makes it easier to compare actual results with budgeted figures and make necessary adjustments.
Regular Review and Cleanup: Regularly review your COA for irrelevance or redundancy. Cleaning up your COA can help streamline your accounting processes and ensure you're getting accurate financial insights.
Use Departments or Locations: If your business has multiple departments or locations, consider creating separate accounts or sub-accounts for each. This can help you track the profitability of different parts of your business and make informed decisions about resource allocation.
Leverage Your Accounting Software: Modern accounting software like Xero offers features that can help you analyze your COA data. Use these features to generate reports, track trends, and forecast future financial performance.
Understand the Impact of Timing: The timing of revenue and expense recognition can significantly impact your profitability. Understanding when to record transactions (accrual basis vs. cash basis accounting) can provide a more accurate picture of your financial health.
Remember, the goal of these "hacks" is not just to increase profit in the short term, but to build a stronger, more profitable business in the long run. By giving you a clearer picture of your financial performance, a well-managed COA can be a powerful tool for driving business growth and success
Balance Sheet ratios are key indicators of a company's financial health, and they provide insights into various aspects such as liquidity, efficiency, and profitability. But to compute these ratios and extract meaningful insights, you need a well-structured and accurate Chart of Accounts (COA).
Let's explore some common Balance Sheet ratios and how a properly set-up COA aids in their calculation and interpretation:
Current Ratio (Liquidity): This ratio is calculated as Current Assets divided by Current Liabilities. It measures your company's ability to cover its short-term obligations. With a well-organized COA, you can easily identify and sum up all current assets and current liabilities, enabling quick and accurate calculation of this ratio.
Quick Ratio (Liquidity): Also known as the Acid-Test Ratio, this is calculated as (Current Assets - Inventory) divided by Current Liabilities. It's a stricter measure of liquidity as it ignores inventory, which may not be easily convertible to cash. A detailed COA with separate accounts for different types of current assets is essential for this calculation.
Debt to Equity Ratio (Leverage): This ratio is Total Liabilities divided by Shareholders' Equity. It shows the proportion of a company's funding that comes from debt versus equity. A COA with clear distinction between different types of liabilities and equity accounts allows for accurate computation.
Return on Equity (Profitability): This is Net Income divided by Shareholders' Equity. It measures the profitability of a company relative to equity. A COA with properly categorized income and expense accounts is crucial for determining net income.
Asset Turnover Ratio (Efficiency): This ratio is Net Sales divided by Total Assets and it measures how efficiently a company uses its assets to generate sales. A COA with separate accounts for different types of sales and assets facilitates this calculation.
A well-set-up Chart of Accounts helps you classify and record financial transactions accurately. This ensures that your Balance Sheet (and other financial statements) accurately reflect your financial status, enabling precise ratio calculations. These ratios provide valuable insights into your company's financial health and performance. They can help identify strengths and weaknesses, inform strategic decisions, and provide stakeholders with a clear picture of your company's financial position.
Income Statement Ratios are critical tools that help in analyzing a company's profitability and operational efficiency. A well-organized Chart of Accounts (COA) is key to accurately calculating these ratios and deriving actionable insights. Here are some common Income Statement Ratios and how a properly set-up COA plays a role in their computation:
Gross Profit Margin: Calculated as Gross Profit divided by Net Sales, this ratio shows the percentage of revenue that remains after subtracting the cost of goods sold (COGS). A detailed COA with separate accounts for different types of revenue and COGS allows for accurate computation of this ratio.
Operating Profit Margin: This ratio, calculated as Operating Profit divided by Net Sales, measures operational efficiency by showing the proportion of revenue left after subtracting all operating expenses. A well-structured COA helps distinguish between operating and non-operating expenses, facilitating accurate calculation.
Net Profit Margin: Net Profit Margin is calculated as Net Income divided by Net Sales. It indicates how much of each dollar of revenue is left as profit after all expenses. A detailed COA with properly categorized income and expense accounts is crucial for determining net income.
Return on Sales: This is Net Income divided by Net Sales. It measures the efficiency with which a company turns sales into profits. A COA with separate accounts for different types of sales and income facilitates this calculation.
Expense Ratio: Calculated as a specific Expense divided by Net Sales, this ratio measures the impact of a particular type of expense on the company's profits. A well-set-up COA with separate accounts for different types of expenses allows for precise calculation of various expense ratios.
These ratios provide valuable insights into your company's profitability and operational efficiency, helping you identify areas of strength and opportunities for improvement.
Remember, the key to effective financial management is not just having the data, but understanding what it means for your business. By setting up your Chart of Accounts correctly, you're laying a strong foundation for insightful financial analysis and data-driven decision-making.
In the journey of financial management, your Chart of Accounts (COA) is your trusty compass. It helps you navigate the complex terrain of revenue and expenses, guiding you towards profitable destinations. By fine-tuning this compass - keeping it updated and tailored to your unique business needs - you can ensure it points you in the right direction.
We've covered a lot of ground in this blog, from the importance of regularly adjusting your COA, to strategic "hacks" that can optimize your profitability. But remember, every business is unique, and there's no one-size-fits-all approach to managing your COA. It's all about finding what works best for you and your business.
And if you ever find yourself lost in the wilderness of account numbers and financial statements, remember that help is just a call or click away. At Accounting Prose, we're more than just accountants - we're your partners in financial success. We're here to help you understand and leverage your COA to drive business growth and profitability.
So why wait? Take the first step towards a more profitable future today. Reach out to our team at Accounting Prose. Let us help you turn your COA from a mere list of accounts into a powerful tool for business success. Let's embark on this journey together.
Ready to rev up your financial engine? Contact us today to get started!

1 min read
Are you a small business owner looking for the right accounting software to manage your finances? Choosing the right accounting software for your...
.png)
1 min read
TL;DR: Enzo from Accounting Prose built an automated system using AI to transform standard financial statements into personalized, actionable...

1 min read
For small businesses, accounting software is a must-have for managing financial data efficiently. In this blog post, we will delve into the details...